Categories:

Injury Specific Training #1

Collapse – Living on the Inside Edge

My intention with the Injury Specific Training (IST) blog series is to compile short media clips and discussion to improve my coaching ability and the way strength and performance professionals train athletes and laypeople. The pictures and videos in this series are from random training videos from social media or media I take of my own clients.

Injury Resistant Training (IRT) series, the opposite to IST, will feature movement and lifts done properly. Combining both series, I’m offering what the problem looks like and what the solution looks like.

A key for coaches given today’s available technology is to ensure the trainee’s mechanics look good in real time AND in slow motion. Slow motion video is a game changer as it allows coaches to develop strategies for correction if needed and regress patterns or make better exercise selections to improve injury resilience.

All videos have been put in slow motion by me. This trainee is a national level female sprinter. I’d like to point out that the right side knee and foot collapse seen in the trap bar deadlight in video 1 carries over directly to the high intensity depth jumps seen in videos 2 and 3.

The trainee shows she does not have the “software” to properly navigate the lift nor the forces involved in the depth jumps at those heights. Coaches should recognize that the collapse seen at near maximal loads in video 1 should be closely monitored during dynamic movement.

Mechanics displayed in these videos are appropriate for moving backwards but not forwards as her knees are going in to out as she applies force into the ground. As a sprinter that runs forward, learning to move in reverse during her training is troublesome.

Future blogs will show the difference between moving forward and backward properly using jumping athletes (high jumper jumping backwards vs. basketball player jumping forward). My ideas are influenced by GOATA Movement. Please take time to review their material.

Posted in General.

Tagged with , , , .


Causation and Prevention of Non-Contact Achilles Tendon Tears

Mechanics that cause non-contact achilles tendon tears while stepping backwards include the following:

  • external hip rotation
  • heel moves towards midline with toes outward
  • inside edge foot pressure
  • flat foot (arch collapse)
  • knees face opposite directions
  • close to terminal knee extension is common
Five NBA achilles tendon tears (pictures 3 and 4 are same player)

The opposite mechanics are protective for non-contact achilles tendon tears. Mechanics that prevent non-contact achilles tendon tears while stepping backwards include the following:

  • internal hip rotation
  • heel moves away from midline with toes inward
  • outside edge foot pressure
  • no arch collapse
  • both knees face same direction
  • heel off the ground with knee facing inward
  • knee flexion
  • pivot on the outside edge of the right foot at the 4th and 5th metatarsals


In the video above, Michael Jordan masterfully steps backwards with his right leg. Stepping backwards safely requires internal rotation of the hip and outside edge foot pressure. Many training facilities repeatedly wire athletes to external rotate the hip while applying inside edge foot pressure (for instance, during the back squat, front squat, or clean). Mechanics learned in the gym setting can contribute to non-contact injuries.

Posted in General.

Tagged with , , , , , .


T3 Therapy to Reset Low Body Temperature in Hypothyroidism

Also see:
Wilson’s Temperature Syndrome
Basis Guidelines Wilson T3 Protocol
Wilson’s Temperature Tracking Chart
Wilson’s low Temperature Syndrome
Wilson Treatment Guidelines
Ray Peat, PhD on Thyroid, Temperature, Pulse, and TSH
Dosing with T3-only (or with low-dose NDT, or the combination of T4/T3)

https://www.youtube.com/watch?v=ztjDtZ87cX0
https://www.youtube.com/watch?v=NH2JU98iBoM

https://www.youtube.com/watch?v=G0QWZbI5Vvs


https://www.youtube.com/watch?v=5dyRatdx43M

Posted in General.

Tagged with , , , , , , , , , , , , , , , , , , , , , , , , , , , , , , , , , , , , , , .


Bodily Resources vs Demands

Also see:
Stress — A Shifting of Resources
Collection of FPS Charts
Sugar (Sucrose) Restrains the Stress Response
Low Blood Sugar Basics
Ray Peat, PhD on Low Blood Sugar & Stress Reaction
Bowel Toxins Accelerate Aging
Exercise Induced Stress
Carbohydrate Lowers Exercise Induced Stress
Low Carb Diet – Death to Metabolism
Can Endurance Sports Really Cause Harm? The Lipopolysaccharides of Endotoxemia and Their Effect on the Heart
Running on Empty
Exercise and Endotoxemia
Ray Peat, PhD on Endotoxin
Endotoxin: Poisoning from the Inside Out
Ray Peat, PhD: Quotes Relating to Exercise

“Life is a condition alternating between excitation, destruction and unbalance, and reorganization, equilibrium and rest.” -Kurt Goldstein

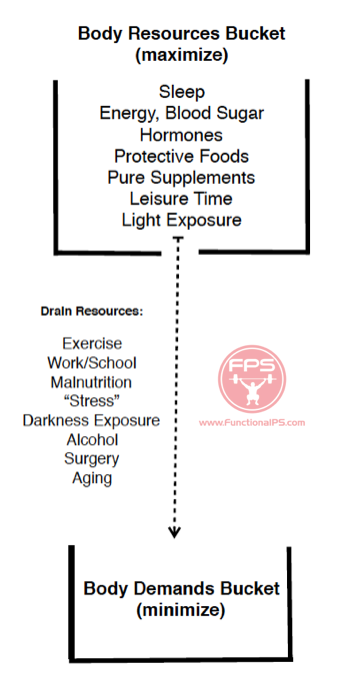
The bucket pictogram below, inspired by the ideas of James Clear, explains many health concepts. The body resources bucket contains some of the primary factors that ensure good health. These resources are drained by the body’s demands (dotted arrow), which vary from person to person.

Bodily Resources vs Demands

Bodily Resources vs Demands

The global objective is to maximize bodily resources and minimize demands to avoid momentary or permanent changes in bodily function. Tilt the scales in your favor.

Screen Shot 2016-08-01 at 7.56.30 PM

The body’s resources are finite, and the rate at which they are depleted is determined by your body’s demands. Maintain body balance by ensuring that your resources always trump your body’s demands by continually depositing resources on a daily basis and reducing demands where possible.

Young people are free of disease because their bodily resources are so vast that demands are easily met. When young people are compromised, they recover easily because they can quickly tilt the scales back in their favor.

There are direct parallels between finance and these two buckets. The resources bucket is analogous to a savings account, and the demands bucket represents total expenses. Don’t spend more money than you have to avoid financial turmoil or bankruptcy. Make deposits into your resources bucket on a daily basis and reduce expenses/demands to ensure protection from resource bankruptcy and a compromised body.

Here are some additional bullet points:

• The contents of each bucket will vary for each person. Some of the most basic elements are listed that apply to most people.
• Weight management and health concerns at their base come about due to imbalance between resources and demands. Each person has his/her own adaptation to the imbalance. Consider how robust your resources are at present and have been over your lifespan. Your present state is a reflection of all your years put together.
• Simple example of this pictogram at work is when one gets a cold or sickness. Someone gets a cold because demands were excessive relative to their (immune) resources. When someone gets a cold, he/she doesn’t go exercise vigorously (which is another demand) because energy levels and appetite are low. Rather, he/she builds lowers demands by taking time off from work/school if possible and sleeping/resting more and eventually eating well to build up his/her resources again to achieve recovery. If a person cannot aggregate the resources necessary to overcome the illness, the illness remains. How often you get sick and how long it takes you to recover when you do get sick is one indicator of how robust your resources bucket is.
• Restorative sleep and midday naps are an outstanding way to lower demands on your system.
• A person with sleep difficulties (sleep apnea, mouth breathing while sleeping, insomnia, waking several times during the night, waking feeling unrested, nocturnal urination, teeth grinding) is often the individual with high demands but low available resources. This creates a vicious cycle because of the inability to lower demands significantly via restorative sleep.

Additional Resources:
“The Stress of Life” by Hans Selye (book)
“Stress Without Distress” by Hans Selye (book)
“Why Zebras Don’t Get Ulcers” by Robert Sapolsky (book)
“Theory of Cumulative Stress – How to Recover When Stress Builds Up” by James Clear (online)

Posted in General.

Tagged with , , , , , , , , , , , , , , .


Calcium to Phosphorus Ratio of Vegetables and Fruits

Also see:
Calcium to Phosphorus Ratio, PTH, and Bone Health
Calcium to Phosphorus Ratio of Milk, Cheeses, Ice Cream by DrJ on RayPeatForum
Calcium Paradox
Source of Dietary Calcium: Chicken Egg Shell Powder
Low CO2 in Hypothyroidism
Blood Pressure Management with Calcium & Dairy
Hypertension and Calcium Deficiency
Excess Dietary Phosphorus Lowers Vitamin D Levels
Fatty Acid Synthase (FAS), Vitamin D, and Cancer
Phosphate, activation, and aging
Parmigiano Reggiano cheese and bone health
Preparing Powdered Eggshells for Calcium
Dairy, Calcium, and Weight Management in Adults and Children

Quotes by Ray Peat, PhD:
“The ratio of calcium to phosphate is very important; that’s why milk and cheese are so valuable for weight loss, or for preventing weight gain. For people who aren’t very active, low fat milk and cheese are better, because the extra fat calories aren’t needed.”

“The foods highest in phosphate, relative to calcium, are cereals, legumes, meats, and fish. Many prepared foods contain added phosphate. Foods with a higher, safe ratio of calcium to phosphate are leaves, such as kale, turnip greens, and beet greens, and many fruits, milk, and cheese.”

“Recent publication are showing that excess phosphate can increase inflammation, tissue atrophy, calcification of blood vessels, cancer, dementia, and, in general, the processes of aging.”

======================================================

This is a useful chart of fruits and vegetables ordered from highest to lowest calcium to phosphorus ratio (Ca:P). A ratio of 1.3:1 or higher is best to help keep parathyroid hormone down and protect cells from energy slowdowns and soft tissues from hardening/calcifying. The fruits and vegetables with a good ratio complement the consumption of milk and cheese.

Chart Source

GUINEA LYNX’ Sortable Veg & Fruit Chart
Pre-sorted to Ca:P
10 Calorie Quantities
Grams Sugar gm Calcium mg Ca:P Phos mg Magn mg Pot mg Sodium mg Vit_A RAE Vit_C mg
COLLARDS 33 0.15 48.33 14.5:1 3.33 3.00 56.33 6.67 111.00 11.77
BUTTERBUR,(FUKI) 71 UNKN 73.57 8.6:1 8.57 10.00 467.86 5.00 2.14 22.50
MUSTARD SPINACH,(TENDERGREEN) 45 UNKN 95.46 7.5:1 12.73 5.00 204.09 9.55 225.00 59.09
PAPAYAS 26 1.51 6.15 4.8:1 1.28 2.60 65.90 0.77 14.10 15.85
TURNIP GREENS 31 0.25 59.38 4.5:1 13.13 9.70 92.50 12.50 180.94 18.75
LAMBSQUARTERS 23 UNKN 71.86 4.3:1 16.74 7.90 105.12 10.00 134.88 18.61
DILL WEED,FRSH 23 UNKN 48.37 3.2:1 15.35 12.80 171.63 14.19 89.77 19.77
BASIL,FRESH 43 0.13 76.96 3.2:1 24.35 27.80 128.26 1.74 114.78 7.83
ARUGULA 40 0.82 64.00 3.1:1 20.80 18.80 147.60 10.80 47.60 6.00
ORANGES,ALL COMM VAR 21 1.99 8.51 2.9:1 2.98 2.10 38.51 UNKN 2.34 11.32
BEET GREENS 45 0.23 53.18 2.9:1 18.64 31.80 346.36 102.73 143.64 13.64
CABBAGE,CHINESE (PAK-CHOI) 77 0.91 80.77 2.8:1 28.46 14.60 193.85 50.00 171.54 34.62
DANDELION GREENS 22 0.16 41.56 2.8:1 14.67 8.00 88.22 16.89 112.89 7.78
CABBAGE,CHINESE (PE-TSAI) 63 0.88 48.13 2.7:1 18.13 8.10 148.75 5.63 10.00 16.88
KALE 20 UNKN 27.00 2.4:1 11.20 6.80 89.40 8.60 153.80 24.00
MUSTARD GREENS 38 0.62 39.62 2.4:1 16.54 12.30 136.15 9.62 201.92 26.92
PARSLEY 28 0.24 38.33 2.4:1 16.11 13.90 153.89 15.56 116.94 36.94
MELONS,CASABA 36 2.03 3.93 2.2:1 1.79 3.90 65.00 3.21 UNKN 7.79
NEW ZEALAND SPINACH 71 UNKN 41.43 2.1:1 20.00 27.90 92.86 92.86 157.14 21.43
WATERCRESS 91 0.18 109.09 2.0:1 54.55 19.10 300.00 37.27 145.46 39.09
SPINACH 43 0.18 43.04 2.0:1 21.30 34.40 242.61 34.35 203.91 12.22
SQUASH,WNTR,SPAGHETTI 32 UNKN 7.42 1.9:1 3.87 3.90 34.84 5.48 0.97 0.68
ENDIVE 59 0.15 30.59 1.9:1 16.47 8.80 184.71 12.94 63.53 3.82
TANGERINES,(MANDARIN ORANGES) 19 1.76 6.98 1.8:1 3.77 2.30 31.32 0.38 6.42 5.04
CELERY 63 1.14 25.00 1.7:1 15.00 6.90 162.50 50.00 13.75 1.94
PINEAPPLE,ALL VAR 20 1.97 2.60 1.6:1 1.60 2.40 21.80 0.20 0.60 9.56
PURSLANE 63 UNKN 40.63 1.5:1 27.50 42.50 308.75 28.13 41.25 13.13
ANISE SEED 3 UNKN 19.17 1.5:1 13.06 5.10 42.76 0.48 0.48 0.62
CABBAGE 40 1.28 16.00 1.5:1 10.40 4.80 68.00 7.20 2.00 14.64
CABBAGE,RED 32 1.24 14.52 1.5:1 9.68 5.20 78.39 8.71 18.07 18.39
SQUASH,WNTR,BUTTERNUT 22 0.49 10.67 1.5:1 7.33 7.60 78.22 0.89 118.22 4.67
BROCCOLI RAAB 45 0.17 49.09 1.5:1 33.18 10.00 89.09 15.00 59.55 9.18
CORIANDER (CILANTRO) LEAVES 43 0.38 29.13 1.4:1 20.87 11.30 226.52 20.00 146.52 11.74
RADISHES 63 1.16 15.63 1.3:1 12.50 6.30 145.63 24.38 UNKN 9.25
BLACKBERRIES 23 1.14 6.74 1.3:1 5.12 4.70 37.67 0.23 2.56 4.88
SQUASH,WNTR,ALL VAR 29 0.65 8.24 1.2:1 6.77 4.10 102.94 1.18 20.00 3.62
LETTUCE,GRN LEAF 67 0.52 24.00 1.2:1 19.33 8.70 129.33 18.67 246.67 12.00
LETTUCE,RED LEAF 63 0.30 20.63 1.2:1 17.50 7.50 116.88 15.63 234.38 2.31
CHERRIES,SOUR,RED 20 1.70 3.20 1.1:1 3.00 1.80 34.60 0.60 12.80 2.00
CRESS,GARDEN 31 1.38 25.31 1.1:1 23.75 11.90 189.38 4.38 108.13 21.56
TURNIPS 36 1.36 10.71 1.1:1 9.64 3.90 68.21 23.93 UNKN 7.50
CARROTS,BABY 29 1.36 9.14 1.1:1 8.00 2.90 67.71 22.29 197.14 0.74
LETTUCE,BUTTERHEAD (INCL BOSTON&BIBB TYPES) 77 0.72 26.92 1.1:1 25.39 10.00 183.08 3.85 127.69 2.85
LETTUCE,COS OR ROMAINE 59 0.70 19.41 1.1:1 17.65 8.20 145.29 4.71 256.47 14.12
CHARD,SWISS 53 0.58 26.84 1.1:1 24.21 42.60 199.47 112.11 161.05 15.79
KIWIFRUIT,GRN 16 1.47 5.57 1.0:1 5.57 2.80 51.15 0.49 0.66 15.20
BEANS,SNAP,GREEN 32 1.05 11.94 1.0:1 12.26 8.10 68.07 1.94 11.29 3.94
SQUASH,WINTER,ACORN 25 UNKN 8.25 0.9:1 9.00 8.00 86.75 0.75 4.50 2.75
MANGOS 15 2.28 1.54 0.9:1 1.69 1.40 24.00 0.31 5.85 4.26
LETTUCE,ICEBERG (INCL CRISPHEAD TYPES) 71 1.41 12.86 0.9:1 14.29 5.00 100.71 7.14 17.86 2.00
CARROTS 24 1.16 8.05 0.9:1 8.54 2.90 78.05 16.83 203.66 1.44
RASPBERRIES 19 0.85 4.81 0.9:1 5.58 4.20 29.04 0.19 0.39 5.04
SALSIFY,(VEG OYSTER) 12 UNKN 7.32 0.8:1 9.15 2.80 46.34 2.44 UNKN 0.98
PEARS 17 1.69 1.55 0.8:1 1.90 1.20 20.52 0.17 0.17 0.72
RUTABAGAS 28 1.56 13.06 0.8:1 16.11 6.40 93.61 5.56 UNKN 6.94
PEAS,EDIBLE-PODDED 24 0.95 10.24 0.8:1 12.62 5.70 47.62 0.95 12.86 14.29
CABBAGE,SAVOY 37 0.84 12.96 0.8:1 15.56 10.40 85.19 10.37 18.52 11.48
SQUASH,WINTER,HUBBARD 25 UNKN 3.50 0.7:1 5.25 4.80 80.00 1.75 17.00 2.75
SQUASH,SMMR,CROOKNECK&STRAIGHTNECK 53 1.86 11.05 0.7:1 16.84 10.50 116.84 1.05 4.21 10.16
STRAWBERRIES 31 1.53 5.00 0.7:1 7.50 4.10 47.81 0.31 0.31 18.38
CUCUMBER,WITH PEEL 67 1.11 10.67 0.7:1 16.00 8.70 98.00 1.33 3.33 1.87
BROCCOLI 29 0.50 13.82 0.7:1 19.41 6.20 92.94 9.71 9.12 26.24
MELONS,CANTALOUPE 29 2.31 2.65 0.6:1 4.41 3.50 78.53 4.71 49.71 10.79
WATERMELON 33 2.07 2.33 0.6:1 3.67 3.30 37.33 0.33 9.33 2.70
CHERRIES,SWEET 16 2.04 2.06 0.6:1 3.33 1.80 35.24 UNKN 0.48 1.11
CRANBERRIES 22 0.88 1.74 0.6:1 2.83 1.30 18.48 0.44 0.65 2.89
BRUSSELS SPROUTS 23 0.51 9.77 0.6:1 16.05 5.40 90.47 5.81 8.84 19.77
SWEET POTATO,UNPREP 12 0.49 3.49 0.6:1 5.47 2.90 39.19 6.40 82.44 0.28
RADISH SEEDS,SPROUTED 23 UNKN 11.86 0.5:1 26.28 10.20 20.00 1.40 4.65 6.72
SQUASH,SUMMER,SCALLOP 56 UNKN 10.56 0.5:1 20.00 12.80 101.11 0.56 3.33 10.00
PEPPERS,SWEET,YELLOW 37 UNKN 4.07 0.5:1 8.89 4.40 78.52 0.74 3.70 67.96
MELONS,HONEYDEW 28 2.26 1.67 0.5:1 3.06 2.80 63.33 5.00 0.83 5.00
GRAPES,RED OR GRN (EURO TYPE,SUCH AS THOMPSON SEEDLESS) 14 2.24 1.45 0.5:1 2.90 1.00 27.68 0.29 0.44 1.57
APPLES,WITH SKIN 19 2.00 1.15 0.5:1 2.12 1.00 20.58 0.19 0.58 0.89
RAISINS,SEEDLESS 3 1.98 1.67 0.5:1 3.38 1.10 25.05 0.37 UNKN 0.08
RAISINS,GOLDEN SEEDLESS 3 1.96 1.76 0.5:1 3.81 1.20 24.70 0.40 UNKN 0.11
BLUEBERRIES 18 1.75 1.05 0.5:1 2.11 1.10 13.51 0.18 0.53 1.70
PEPPERS,SWT,GRN 50 1.20 5.00 0.5:1 10.00 5.00 87.50 1.50 9.00 40.20
KOHLRABI 37 0.96 8.89 0.5:1 17.04 7.00 129.63 7.41 0.74 22.96
ASPARAGUS 50 0.94 12.00 0.5:1 26.00 7.00 101.00 1.00 19.00 2.80
CAULIFLOWER 40 0.76 8.80 0.5:1 17.60 6.00 119.60 12.00 UNKN 19.28
PARSNIPS 13 0.64 4.80 0.5:1 9.47 3.90 50.00 1.33 UNKN 2.27
PUMPKIN 38 0.52 8.08 0.5:1 16.92 4.60 130.77 0.39 141.92 3.46
RADICCHIO 43 0.26 8.26 0.5:1 17.39 5.70 131.30 9.57 0.44 3.48
ALFALFA SEEDS,SPROUTED 43 0.08 13.91 0.5:1 30.44 11.70 34.35 2.61 3.48 3.57
SWEET POTATO LEAVES 29 UNKN 10.57 0.4:1 26.86 17.40 148.00 2.57 14.57 3.14
PLUMS 22 2.16 1.30 0.4:1 3.48 1.50 34.13 UNKN 3.70 2.07
PEARS,ASIAN 24 1.68 0.95 0.4:1 2.62 1.90 28.81 UNKN UNKN 0.91
BEETS 23 1.57 3.72 0.4:1 9.30 5.40 75.58 18.14 0.47 1.14
SQUASH,SMMR,ZUCCHINI,INCL SKN 59 1.47 9.41 0.4:1 22.35 10.60 153.53 4.71 5.88 10.53
TOMATOES,RED,RIPE,YEAR RND AVERAGE 56 1.46 5.56 0.4:1 13.33 6.10 131.67 2.78 23.33 7.06
SQUASH,SMMR,ALL VAR 63 1.38 9.38 0.4:1 23.75 10.60 163.75 1.25 6.25 10.63
BEANS,FAVA,IN POD 11 UNKN 4.21 0.3:1 14.66 3.80 37.73 2.84 1.93 0.42
PEACHES 26 2.15 1.54 0.3:1 5.13 2.30 48.72 UNKN 4.10 1.69
PEPPERS,SWT,RED 32 1.36 2.26 0.3:1 8.39 3.90 68.07 1.29 50.65 41.19
YAM 8 0.04 1.44 0.3:1 4.66 1.80 69.15 0.76 0.59 1.45
SQUASH,ZUCCHINI,BABY 48 UNKN 10.00 0.2:1 44.29 15.70 218.57 1.43 11.91 16.24
PEAS,MATURE SEEDS,SPROUTED 8 UNKN 2.90 0.2:1 13.31 4.50 30.73 1.61 UNKN 0.84
NECTARINES 23 1.79 1.36 0.2:1 5.91 2.10 45.68 UNKN 3.86 1.23
BANANAS 11 1.37 0.56 0.2:1 2.47 3.00 40.23 0.11 0.34 0.98
PEAS,GREEN 12 0.70 3.09 0.2:1 13.33 4.10 30.12 0.62 4.69 4.94
LENTILS,SPROUTED 9 UNKN 2.36 0.1:1 16.32 3.50 30.38 1.04 0.19 1.56
OATS 3 UNKN 1.39 0.1:1 13.45 4.60 11.03 0.05 UNKN UNKN
WHEAT GERM,CRUDE 3 UNKN 1.08 0.0:1 23.39 6.60 24.78 0.33 UNKN UNKN
CORN,SWT,YEL 12 0.73 0.23 0.0:1 10.35 4.30 31.40 1.74 1.05 0.79
CEREALS RTE,WHEAT GERM,TSTD,PLN 3 0.20 1.18 0.0:1 30.00 8.40 24.79 0.11 0.13 0.16

Posted in General.

Tagged with , , , , , , , , , , , .


Scott Sonnon Intuflow Joint Mobility

Beginner:


Intermediate:


Posted in General.

Tagged with , , , , , , , .


Low Estrogen Content in Milk

Also see:
Toxic Plant Estrogens
Calcium to Phosphorus Ratio, PTH, and Bone Health
Calcium Paradox
Source of Dietary Calcium: Chicken Egg Shell Powder
Low CO2 in Hypothyroidism
Blood Pressure Management with Calcium & Dairy
Hypertension and Calcium Deficiency
Excess Dietary Phosphorus Lowers Vitamin D Levels
Fatty Acid Synthase (FAS), Vitamin D, and Cancer
Phosphate, activation, and aging
Parmigiano Reggiano cheese and bone health
Preparing Powdered Eggshells for Calcium
Dairy, Calcium, and Weight Management in Adults and Children

Key thoughts:
1. Low estrogen concentrations in milk.
2. More dietary fat equates to more estrogen content.
3. Goat milk has less estrogen than cow’s milk although both are low.
4. A study reporting high estrogen content in milk should also measure progesterone levels.

==========

J Dairy Sci. 2010 Jun;93(6):2533-40. doi: 10.3168/jds.2009-2947.
Estrone and 17beta-estradiol concentrations in pasteurized-homogenized milk and commercial dairy products.
Pape-Zambito DA1, Roberts RF, Kensinger RS.
Some individuals fear that estrogens in dairy products may stimulate growth of estrogen-sensitive cancers in humans. The presence of estrone (E(1)) and 17beta-estradiol (E(2)) in raw whole cow’s milk has been demonstrated. The objectives of this study were to determine if pasteurization-homogenization affects E(2) concentration in milk and to quantify E(1) and E(2) concentrations in commercially available dairy products. The effects of pasteurization-homogenization were tested by collecting fresh raw milk, followed by pasteurization and homogenization at 1 of 2 homogenization pressures. All treated milks were tested for milk fat globule size, percentages of milk fat and solids, and E(2) concentrations. Estrone and E(2) were quantified from organic or conventional skim, 1%, 2%, and whole milks, as well as half-and-half, cream, and butter samples. Estrone and E(2) were quantified by RIA after organic solvent extractions and chromatography. Pasteurization-homogenization reduced fat globule size, but did not significantly affect E(2), milk fat, or milk solids concentrations. Estrone concentrations averaged 2.9, 4.2, 5.7, 7.9, 20.4, 54.1 pg/mL, and 118.9 pg/g in skim, 1%, 2%, and whole milks, half-and-half, cream, and butter samples, respectively. 17Beta-estradiol concentrations averaged 0.4, 0.6, 0.9, 1.1, 1.9, 6.0 pg/mL, and 15.8 pg/g in skim, 1%, 2%, whole milks, half-and-half, cream, and butter samples, respectively. The amount of fat in milk significantly affected E(1) and E(2) concentrations in milk. Organic and conventional dairy products did not have substantially different concentrations of E(1) and E(2). Compared with information cited in the literature, concentrations of E(1) and E(2) in bovine milk are small relative to endogenous production rates of E(1) and E(2) in humans.

J Dairy Sci. 2007 Jul;90(7):3308-13.
Concentrations of 17beta-estradiol in Holstein whole milk.
Pape-Zambito DA1, Magliaro AL, Kensinger RS.
Some individuals have expressed concern about estrogens in food because of their potential to promote growth of estrogen-sensitive human cancer cells. Researchers have reported concentrations of estrogen in milk but few whole milk samples have been analyzed. Because estrogen associates with the fat phase of milk, the analysis of whole milk is an important consideration. The objectives of this study, therefore, were to quantify 17beta-estradiol (E2) in whole milk from dairy cows and to determine whether E2 concentrations in milk from cows in the second half of pregnancy were greater than that in milk from cows in the first half of pregnancy or in nonpregnant cows. Milk samples and weights were collected during a single morning milking from 206 Holstein cows. Triplicate samples were collected and 2 samples were analyzed for fat, protein, lactose, and somatic cell counts (SCC); 1 sample was homogenized and analyzed for E2. The homogenized whole milk (3 mL) was extracted twice with ethyl acetate and once with methanol. The extract was reconstituted in benzene:methanol (9:1, vol/vol) and run over a Sephadex LH-20 column to separate E2 from cholesterol and estrone before quantification using radioimmunoassay. Cows were classified as not pregnant (NP, n = 138), early pregnant (EP, 1 to 140 d pregnant, n = 47), or midpregnant (MP, 141 to 210 d pregnant, n = 21) at the time of milk sampling based on herd health records. Mean E2 concentration in whole milk was 1.4 +/- 0.2 pg/mL and ranged from nondetectable to 22.9 pg/mL. Milk E2 concentrations averaged 1.3, 0.9, and 3.0 pg/mL for NP, EP, and MP cows, respectively. Milk E2 concentrations for MP cows were greater and differed from those of NP and EP cows. Milk composition was normal for a Holstein herd in that log SCC values and percentages of fat, protein, and lactose averaged 4.9, 3.5, 3.1, and 4.8, respectively. Estradiol concentration was significantly correlated (r = 0.20) with percentage fat in milk. Mean milk yield was 18.9 +/- 0.6 kg for the morning milking. The mean E2 mass accumulated in the morning milk was 23.2 +/- 3.4 ng/cow. Likewise, using the overall mean concentration for E2 in milk, the mean E2 mass in 237 mL (8 fluid ounces) of raw whole milk was 330 pg. The quantity of E2 in whole milk, therefore, is low and is unlikely to pose a health risk for humans.

J Dairy Sci. 1979 Sep;62(9):1458-63.
Measurement of estrogens in cow’s milk, human milk, and dairy products.
Wolford ST, Argoudelis CJ.
Free natural estrogens in raw and commercial whole milk were quantitated by radioimmunoassay. The ranges of concentration of estrone, estradiol 17-beta, and estriol were 34 to 55, 4 to 14, and 9 to 31 pg/ml. Proportions of active estrogens (estrone and estradiol) in the fat phases of milk by radioactive tracer on separated milk were 80% and 65%. These findings were supported by radioimmunoassay of skim milk and butter. Equilibrium dialysis of skim milk with hydrogen 3 labeled estrogens showed that 84 to 85% of estrone and estradiol and 61 to 66% of estriol were protein bound. Whey proteins demonstrated a greater binding capacity than casein. This result was confirmed by radioimmunoassay of dry curd cottage cheese and whey. The concentrations in curd were 35, 11, and 6 pg/g. In whey they were 4, 2, and 3 pg/ml. The quantity of active estrogens in dairy products is too low to demonstrate biological activity. Butter was highest with concentrations of 539, 82, and 87 pg/g. Human colostrum demonstrated a maximum concentration of 4 to 5 ng/ml for estrone and estriol and about .5 ng/ml for estradiol. By the 5th day postpartum, they decreased to become similar to cow’s milk.

J Dairy Sci. 2012 Apr;95(4):1699-708. doi: 10.3168/jds.2011-5072.
Comparison of estrone and 17β-estradiol levels in commercial goat and cow milk.
Farlow DW1, Xu X, Veenstra TD.
Increased levels of estrogen metabolites are believed to be associated with cancers of the reproductive system. One potential dietary source of these metabolites that is commonly consumed worldwide is milk. In North America, dairy cows are the most common source of milk; however, goats are the primary source of milk worldwide. In this study, the absolute concentrations of unconjugated and total (unconjugated plus conjugated) estrone (E(1)) and 17β-estradiol (E(2)) were compared in a variety of commercial cow milks (regular and organic) and goat milk. A lower combined concentration of E(1) and E(2) was found in goat milk than in any of the cow milk products tested. The differences in E(1) and E(2) levels between regular and organic cow milks were not as significant as the differences between goat milk and any of the cow milk products. Goat milk represents a better dietary choice for individuals concerned with limiting their estrogen intake.

Iran J Public Health. 2015 Jun; 44(6): 742–758
Hormones in Dairy Foods and Their Impact on Public Health – A Narrative Review Article
Hassan MALEKINEJAD and Aysa REZABAKHSH

Posted in General.

Tagged with , , , , , , , , , , , , , , , , , , , , , .


NuSI Hall Study: No Ketogenic Advantage

Also See:
Ketogenic low-carbohydrate diets have no metabolic advantage over nonketogenic low-carbohydrate diets.
Blood ketones are directly related to fatigue and perceived effort during exercise in overweight adults adhering to low-carbohydrate diets for weight loss: a pilot study.
PUFA, Ketones, and Sugar Restriction Promote Tumor Growth
Tumor Bearing Organisms – Lipolysis and Ketogenesis as Signs of Chronic Stress
Free Fatty Acids Suppress Cellular Respiration
The Randle Cycle
Ray Peat, PhD on Low Blood Sugar & Stress Reaction

Posted in General.

Tagged with , , , , , , , , , .


Polyunsaturating America: Mazola’s Marketing

Also see:
PUFA Promote Cancer
Unsaturated Fats and Heart Damage
Gelatin Ads
Sugar Ads
Errors in Nutrition: Essential Fatty Acids
Toxicity of Stored PUFA
Dietary PUFA Reflected in Human Subcutaneous Fat Tissue
PUFA Accumulation & Aging
Maternal PUFA Intake Increases Breast Cancer Risk in Female Offspring
Israeli Paradox: High Omega -6 Diet Promotes Disease
Benefits of Aspirin
Arachidonic Acid’s Role in Stress and Shock
Charts: Mean SFA, MUFA, & PUFA Content of Various Dietary Fats
Unsaturated fatty acids: Nutritionally essential, or toxic? by Ray Peat, PhD
“Curing” a High Metabolic Rate with Unsaturated Fats
Fat Deficient Animals – Activity of Cytochrome Oxidase
Anti-Inflammatory Omega -9 Mead Acid (Eicosapentaenoic acid)
Protective “Essential Fatty Acid Deficiency”
Cholesterol and Thyroid Connection
Thyroid Status and Cardiovascular Disease

A few factors collide starting in the 1970s to further expedite a departure from traditional animal fats towards polyunsaturated plant oils:

  • US government, under Nixon, subsidizes corn (corn oil/Mazola). Government later subsidizes soy and wheat.
  • Cheaper vegetable and seed (liquid) oils progressively replace animal fats, capitalizing on the ridiculous anti-cholesterol campaign and faulty lipid hypothesis.
  • Nutritional information from the government supports American industry, not health.

Mazola’s marketing campaign in the 1970s put polyunsaturated fats front and center in the American vernacular and placed saturated fats firmly as the bad guy. The marketing encouraged women to “polyunsaturate” their loved ones while avoiding saturates; in retrospect, this is the exact opposite of what is desired.

Over 40 years later, the US is still suffering from the ubiquitous use of vegetable oils. While milk, sugar, fructose, salt, and saturated fat take a beating from American society as nutritional toxins, polyunsaturated fats in their various forms continue to get a free pass. Evidence from Ray Peat, PhD and the FPS blog will hopefully help people come to their senses.

09-mazola2-1960s-ads-fsl

905_original

b3d8670c66c61cc9e0888a3cfc9f84ed

mYabOrF-ejAZzd4J4ecHAew

3501a

s-l225

ad2

il_340x270.718767408_bdkk

Posted in General.

Tagged with , , , , , , , , , , , , , , , , , , , , , , , , .


Vitamin E Needs Increases with PUFA Consumption and Greater Unsaturation

Also See:
Your MUFA + PUFA Intakes Determine Your True Vitamin E Requirements – N-3s are the Worst Offenders + Even MUFAs Need Buffering | Tool to Calculate Your Individual NeedsVitamin E and Autoimmune Disease
Autoimmune Disease and Estrogen Connection
Dietary PUFA Reflected in Human Subcutaneous Fat Tissue
Toxicity of Stored PUFA
Israeli Paradox: High Omega -6 Diet Promotes Disease
PUFA Accumulation & Aging
Protective “Essential Fatty Acid Deficiency”
PUFA Promote Stress Response; Saturated Fats Suppress Stress Response
PUFA, Fish Oil, and Alzheimers

Int J Vitam Nutr Res. 2000 Mar;70(2):31-42.
Relationship between vitamin E requirement and polyunsaturated fatty acid intake in man: a review.
Valk EE1, Hornstra G.
Vitamin E is the general term for all tocopherols and tocotrienols, of which alpha-tocopherol is the natural and biologically most active form. Although gamma-tocopherol makes a significant contribution to the vitamin E CONTENT in foods, it is less effective in animal and human tissues, where alpha-tocopherol is the most effective chain-breaking lipid-soluble antioxidant. The antioxidant function of vitamin E is critical for the prevention of oxidation of tissue PUFA. Animal experiments have shown that increasing the degree of dietary fatty acid unsaturation increases the peroxidizability of the lipids and reduces the time required to develop symptoms of vitamin E deficiency. From these experiments, relative amounts of vitamin E required to protect the various fatty acids from being peroxidized, could be estimated. Since systematic studies on the vitamin E requirement in relation to PUFA consumption have not been performed in man, recommendations for vitamin E intake are based on animal experiments and human food intake data. An intake of 0.6 mg alpha-tocopherol equivalents per gram linoleic acid is generally seen as adequate for human adults. The minimum vitamin E requirement at consumption of fatty acids with a higher degree of unsaturation can be calculated by a formula, which takes into account the peroxidizability of unsaturated fatty acids and is based on the results of animal experiments. There are, however, no clear data on the vitamin E requirement of humans consuming the more unsaturated fatty acids as for instance EPA (20:5, n-3) and DHA (22:6, n-3). Studies investigating the effects of EPA and DHA supplementation have shown an increase in lipid peroxidation, although amounts of vitamin E were present that are considered adequate in relation to the calculated oxidative potential of these fatty acids. Furthermore, a calculation of the vitamin E requirement, using recent nutritional intake data, shows that a reduction in total fat intake with a concomitant increase in PUFA consumption, including EPA and DHA, will result in an increased amount of vitamin E required. In addition, the methods used in previous studies investigating vitamin E requirement and PUFA consumption (for instance erythrocyte hemolysis), and the techniques used to assess lipid peroxidation (e.g. MDA analysis), may be unsuitable to establish a quantitative relation between vitamin E intake and consumption of highly unsaturated fatty acids. Therefore, further studies are required to establish the vitamin E requirement when the intake of longer-chain, more-unsaturated fatty acids is increased. For this purpose it is necessary to use functional techniques based on the measurement of lipid peroxidation in vivo. Until these data are available, the widely used ratio of at least 0.6 mg alpha-TE/g PUFA is suggested. Higher levels may be necessary, however, for fats that are rich in fatty acids containing more than two double bonds.

Br J Nutr. 2015 Oct 28;114(8):1113-22. doi: 10.1017/S000711451500272X. Epub 2015 Aug 21.
Vitamin E function and requirements in relation to PUFA.
Raederstorff D1, Wyss A1, Calder PC2, Weber P1, Eggersdorfer M1.
Vitamin E (α-tocopherol) is recognised as a key essential lipophilic antioxidant in humans protecting lipoproteins, PUFA, cellular and intra-cellular membranes from damage. The aim of this review was to evaluate the relevant published data about vitamin E requirements in relation to dietary PUFA intake. Evidence in animals and humans indicates a minimal basal requirement of 4-5 mg/d of RRR-α-tocopherol when the diet is very low in PUFA. The vitamin E requirement will increase with an increase in PUFA consumption and with the degree of unsaturation of the PUFA in the diet. The vitamin E requirement related to dietary linoleic acid, which is globally the major dietary PUFA in humans, was calculated to be 0·4-0·6 mg of RRR-α-tocopherol/g of linoleic acid. Animal studies show that for fatty acids with a higher degree of unsaturation, the vitamin E requirement increases almost linearly with the degree of unsaturation of the PUFA in the relative ratios of 0·3, 2, 3, 4, 5 and 6 for mono-, di-, tri-, tetra-, penta- and hexaenoic fatty acids, respectively. Assuming a typical intake of dietary PUFA, a vitamin E requirement ranging from 12 to 20 mg of RRR-α-tocopherol/d can be calculated. A number of guidelines recommend to increase PUFA intake as they have well-established health benefits. It will be prudent to assure an adequate vitamin E intake to match the increased PUFA intake, especially as vitamin E intake is already below recommendations in many populations worldwide.

Z Ernahrungswiss. 1991 Sep;30(3):174-80.
On the problematic nature of vitamin E requirements: net vitamin E.
Bässler KH1.
The requirement for vitamin E is closely related to the dietary intake of polyunsaturated fatty acids (PUFA). By the protective mechanism to prevent PUFA from being peroxidized, vitamin E is metabolically consumed. In addition, PUFA impair the intestinal absorption of vitamin E. Therefore PUFA generate an additional vitamin E requirement on the order of 0.6, 0.9, 1.2, 1.5, and 1.8 mg vitamin E (RRR-alpha-tocopherol-equivalents), respectively, for 1 g of dienoic, trienoic, tetraenoic, pentaenoic, and hexaenoic acid. For this reason, the gross vitamin E content of food containing PUFA does not allow an evaluation of this food as a source of vitamin E. A suitable measure is the net vitamin E content, i.e., gross vitamin E minus the amount needed for PUFA protection. Therefore, some food-stuffs generally considered as vitamin-E sources, as concluded from their gross vitamin E content, cause in reality a vitamin E deficiency if not sufficiently compensated by other vitamin E supplying food constituents. Examples of the net vitamin E content of some fats and oils, fish and nuts are shown. Consequences for food composition data and food labeling and the problem of meeting the vitamin-E requirements are discussed.

Posted in General.

Tagged with , , , , , , , , , , , , , , .